Python for Creating Data Dashboards
Covid-19 Dashboard built and deployed using iPywidgets, Voila and Binders. Based on UK Government data published by Public Health England

Github repo: https://github.com/yuzom/covid-19_dashboard
Dashboard: https://mybinder.org/v2/gh/yuzom/covid-19_dashboard/main?urlpath=voila%2Frender%2Fcovid-19_dashboard.ipynb (long load time due to free service)
Introduction
This dashboard uses publicly available data from Public Health England (PHE). The data is made available through their python API library:
from uk_covid19 import Cov19API
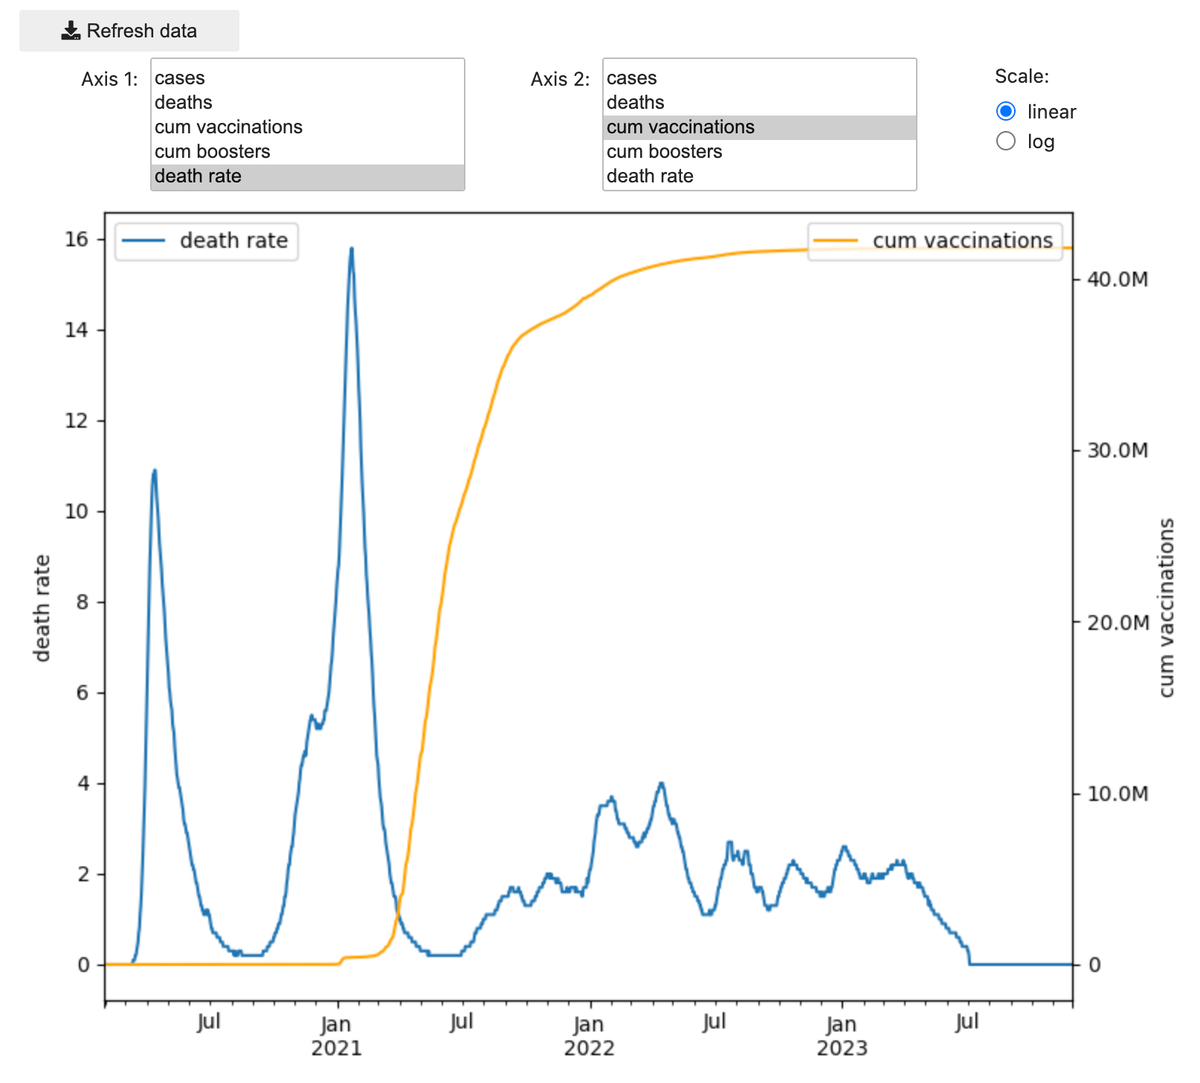
Two Variables on Timeseries

- Choose one variable on each axes to explore their relationship
- For example, take a look at the death rate after vaccinations are administered
Cases by Region

- See the age distributions for cases broken down by sex and region
- Select male, female, total cases, or any combination of the three
- Warning: refreshing this data may take up to a minute